VisiWave Site Survey Quick Start Guide
Welcome to VisiWave Site Survey. Here you will learn the basic steps
required for performing a site survey using VisiWave Site Survey. We will go
over both collecting data and creating reports.
We assume you have already installed the product. If you haven't, please go to
http://www.visiwave.com and click on the
Download link. Then follow the instructions for downloading and
installing the product.
Starting the Application
From the Windows Start menu, click on All Programs and then VisiWave Site
Survey. Here you will see menu items for launching the VisiWave
application, a link to the User's Guide in PDF format, a link to VisiWave's
website, a link to uninstall VisiWave, and a link to this guide.
For instructions that go beyond this quick start guide, click on the
User's Guide menu item to view the full product manual.
Click on the VisiWave Site Survey menu item to launch the application.

The Evaluation Version Reminder
During the evaluation period, you will occasionally be reminded that you
are using a version designed just for evaluating the product. Click on
OK to get past this dialog. If you purchased the product, you
won't see this message.

Creating a New Survey File
You are first asked for the survey map of the site you are going to survey.
Under Floor Plan Image File, select your own GIF, JPEG, PNG, BMP, or PDF survey map image
file or just use the sample one shipped with the product (typically found in
My Site Surveys under My Documents). Then click OK.
Next you will see a window asking you to set the scale of the survey map.
The Scale value represents the width of a pixel in the survey map
image in either feet or meters. A fairly accurate value for the scale
must be supplied. Otherwise, the graphs will not be displayed correctly.
For this example, if you don't know the scale, you can enter 1.0. You can correct
the value at any time using the Set Scale menu item.
Click OK to display the survey map and begin performing
a site survey.
Collecting Survey Data
You should now see the survey map displayed in the window. It's
time to start collecting data. The first step is to select a capture mode.
Do this by clicking on the push-pin icon that selects the
Point-by-Point capture mode. This means that every time you click on
the survey map image, wireless data is captured and associated with the location
where you clicked.
For this example, you don't have to physically move your laptop between
clicks if you don't want to, but in a real survey you would walk around while
clicking on the screen.
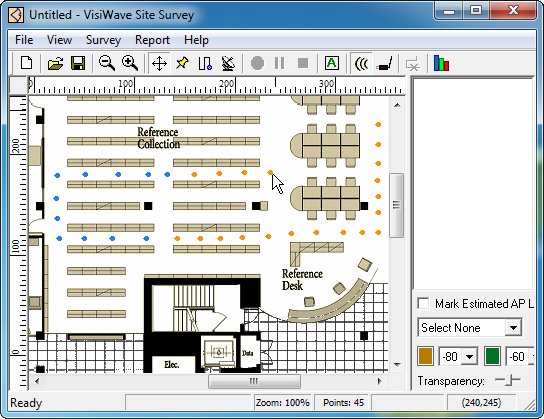
Add a data point by clicking on the survey map with your mouse. Add several more
data points. Each data point is represented by a small dot. A dark colored dot means
the signal strength is strong. A red dot means no wireless signal was found.
More
Details About Collecting Data
If you get an error when you try to add a data point that says no wireless
adapter was found, then either you don't have a supported wireless adapter, or
maybe VisiWave isn't selecting the wireless adapter you want. First, bring up
the Options dialog under the File menu. A list of your computer's wireless
adapters should appear under Wireless Adapter. If you have more than
one adapter, make sure the one you want to use is selected. If this list is
empty, VisiWave couldn't find a supported wireless adapter. You should download
the free utility CheckAdapter from VisiWave's website. Run this tool and
send the results to VisiWave. VisiWave will try to assist you.
The status bar along the bottom of the window has several values listed in
it. Some values only appear for a few seconds after you add a data point. The
value in the second box from the right lists the signal strength (in dB) and the
signal-to-noise ratio (in dBm). The third box from the right lists the number
of data points collected so far.
You will probably want to try out the Continuous data capture mode as
well. This works well for adding many data points at once while walking along
a straight line in your survey space. Just click on the map at your current
location everytime you turn.

Viewing Reports
Once you have collected your survey data, you will want to view the results.
This is done by switching to the report view. Click on the Report View icon in
the toolbar or click on the View menu and select Report View (Alt-R). The
report view is shown.
In the upper left corner of the window is a list of all the types of report items
you can include in your report. This list is split into two sublists: Quick Views
and Report Items. You use the Quick Views items as a starting point for items you
add to your report. Only items listed under Report Items become pages in your final
report.
Click on the Heatmap item under Quick Views. This displays the survey map in the
right pane and the item's properties just below the report items in the left pane.
You can change any properties to change the appearance of the heatmap. You will
especially want to select the APs you want mapped in the heatmap using the AP Filter
list. Once you select one or more APs in the AP Filter, the colored heatmap is drawn
in the pane on the right.
To add this as a page in your report, click the Add to Report button. A copy of this
item is then added to the Report Items list. Keep adding more Quick Views to the Report
Items section until you have a complete report. Then click on Generate Report to create
an HTML or PDF survey report.


